
Last updated: 2026-05-29
Acquisition work is usually scattered. The screen where I build a form. The screen where I build an ad. The screen where I manage the form. The screen where I manage the ad. And the screen where I analyze. Each one lives somewhere else, and I move between them again and again. What I set out to test here is whether that scatter can be gathered into a single conversation. Assume the ads are already running. From there, I pull the ad KPIs in chat, fuse them with form outcomes, derive acquisition cost and charts, and rebuild the ad on the spot. Over eight days of small spend, I record honestly what I was actually able to retrieve.
Ad KPIs come back in chat with one request
The first thing I checked was whether I could draw out the performance of a running ad through conversation alone, without opening the admin screen.
The short answer is yes. The standard metrics come back from a single plain request in chat.
Over eight days, the ad spent ¥6,597. There were 5,578 impressions, a reach of 3,065 people, and a frequency of 1.82. There were 704 clicks, a CTR of 12.62%, a CPC shown in the admin as ¥9, and a CPM of ¥1,183.
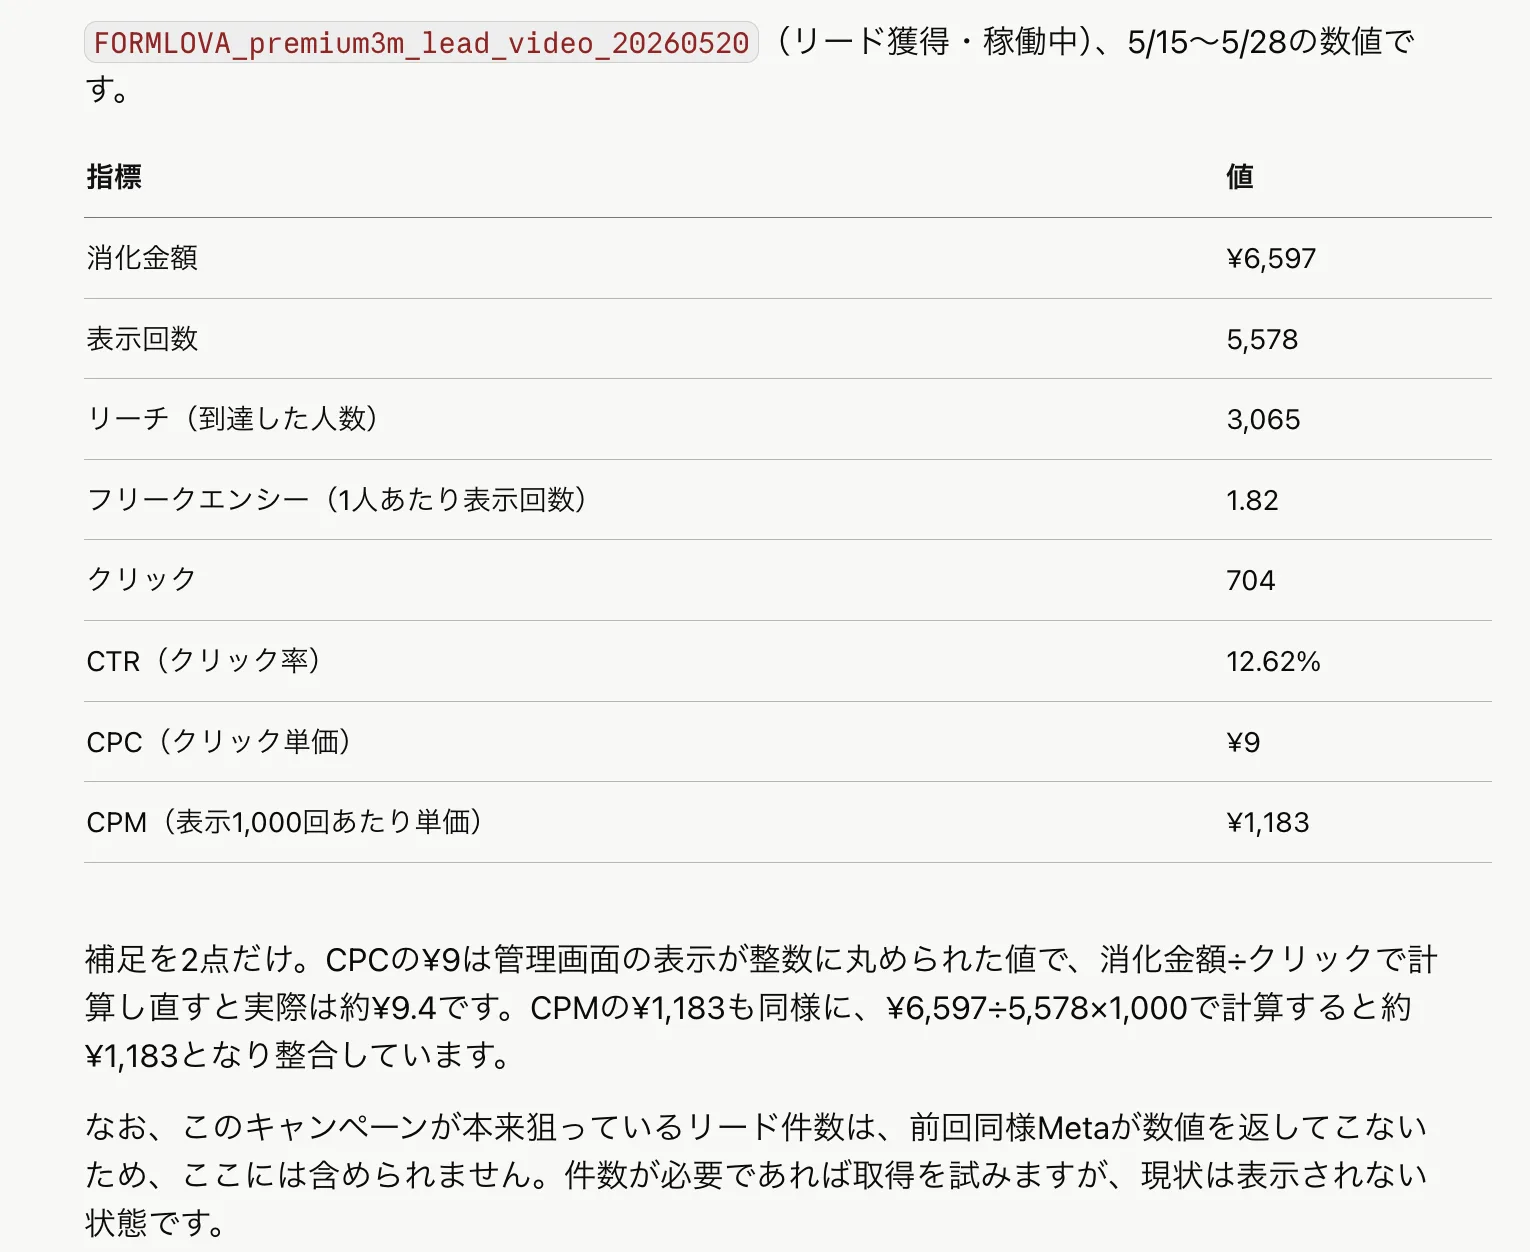
Taken on their own, the numbers look fine. A CTR of 12.62% is on the high side for an ad meant to gather sign-ups. The ¥9 CPC is cheap too. At ¥9 per click, even 704 clicks stay small in cost.
But I will not show only the flattering figures. The ¥9 CPC is a value the admin rounded. Divide spend by clicks and the real figure is about ¥9.4. And what this cheap click actually led to is not visible from this screen alone. The rest comes into view later, once I fuse it with the form-side data.
For lead counts, Meta returned no number. Only the name of the metric came back; the count column stayed empty. So this time I decided to read the outcome count not from Meta's screen but from the form-side conversions.
Even so, the foundation was in place. Spend, impressions, reach, frequency, clicks, CTR, CPC, CPM. The baseline numbers for judging an ad sat in front of me through conversation alone. That is the starting point of the analysis.
Bringing ads and forms into one conversation
This is the core of the verification.
The ad-side numbers alone cannot tell me what the clicks were. So, inside the same chat, I switched to the FORMLOVA-side data. An MCP for the ads, and FORMLOVA's MCP. I move between the two connectors within one conversation. MCP is the shared doorway through which an AI client connects safely to an outside service.
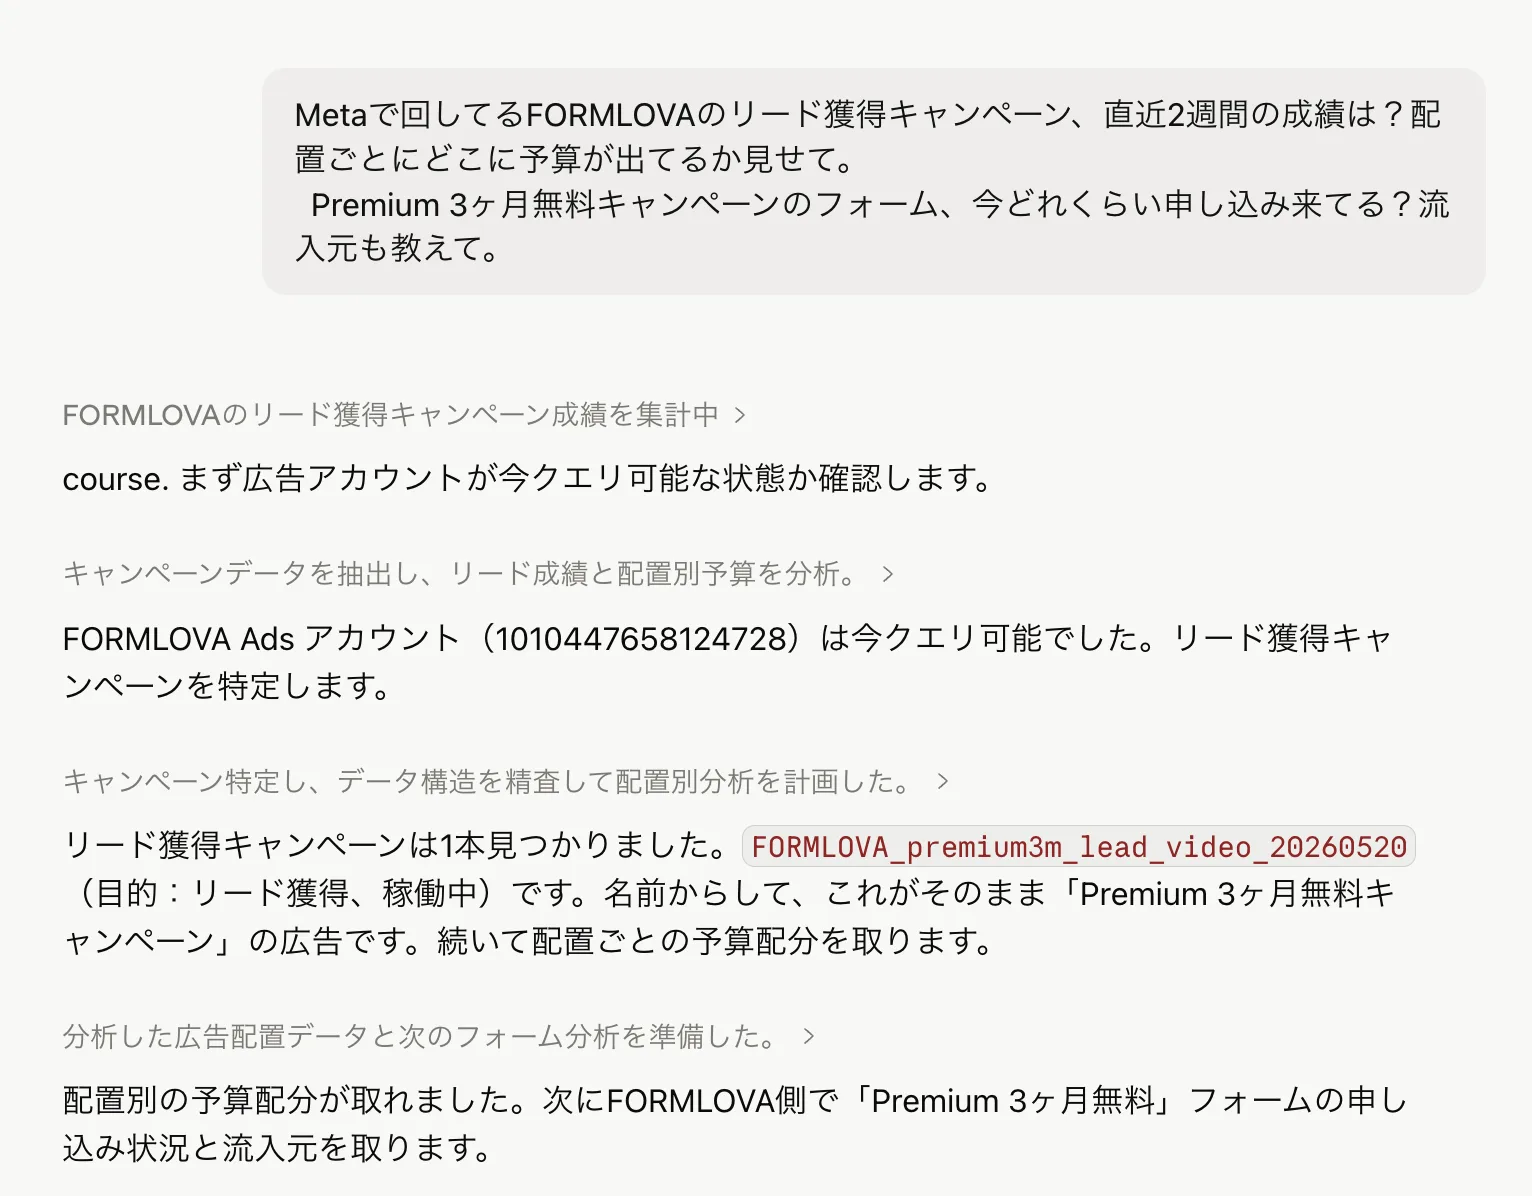
The landing point this time was the campaign's registration form. From here, I look at how the people the ad brought in actually behaved, on the form side.
On the FORMLOVA side, there is a feature that breaks form responses down by ad ID. Which ad a response came from can be told apart on the form side.
This is where fusing the two MCPs earns its value.
Divide the ad-side spend by the FORMLOVA-side conversion count, and acquisition cost falls out, right here in chat. This is not the lead count Meta declined to return. Even so, using the form-side figures, I can assemble the acquisition-cost metric inside the conversation. Looking at only one MCP never reaches this calculation. The ad side alone ends at "clicks came in"; the form side alone ends at "responses arrived." Only by fusing the two in the same conversation do they connect.
From here, I look at the contents of the delivery in more detail: the daily movement, and the breakdown by placement.
Charting it inside the chat
Next I checked whether I could build charts in chat, not just tables.
This worked too. Spend, impressions, clicks, CTR. Switching between the metrics I wanted to see, I could chart the eight-day daily trend on the spot.
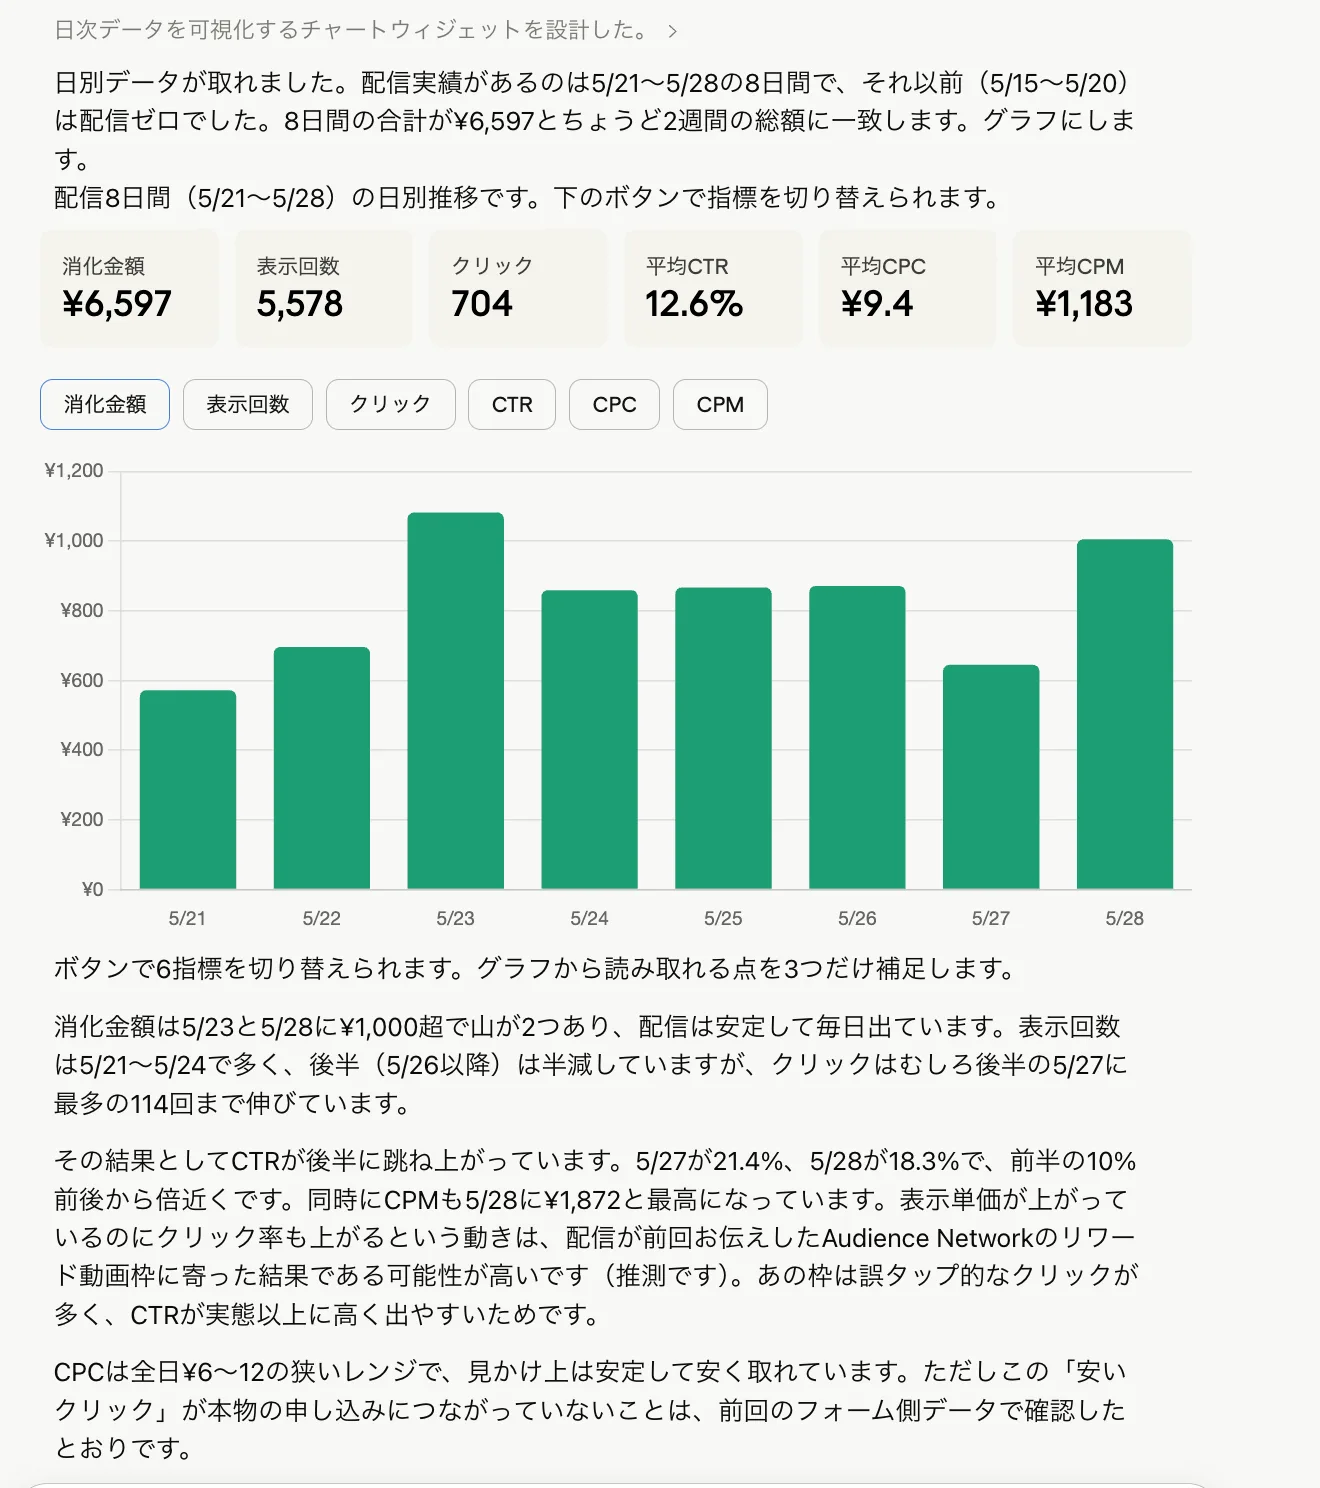
Spend was delivered steadily every day, roughly in the ¥570 to ¥1,080 range. May 23 and 28 were peaks above ¥1,000.
What caught my attention was the movement of impressions and CTR. Impressions were high in the first half and halved from the 26th onward. Clicks, meanwhile, peaked at 114 on May 27. CTR jumped in the second half too: 21.4% on the 27th and 18.3% on the 28th. The first half was around 10%, so the second half was nearly double. CPM also peaked at ¥1,872 on the 28th.
The price per impression rises, yet CTR rises too. That is a little unnatural. Normally, placements with a rising impression price are more competitive and not necessarily easier to click.
From here, some of this is inference. I read it as most likely the result of delivery shifting in the second half toward the rewarded-video slots of Audience Network. Those slots appear inside apps where you get a reward for watching a video. Because of that, near-mistap clicks are common, and they are known as slots where CTR tends to come out higher than reality. The number of clicks alone does not tell you whether they led anywhere.
What matters here is that, across this whole sequence of checks, I never once reopened the ad admin screen. Calling a metric, charting it, switching to another metric -- it all finished inside the same chat. Opening the dashboard for every analysis, reapplying filters, moving to yet another screen: that round-trip disappears.
When you want to make the lead-source tally a weekly routine, the official workflow Lead source report is also available. It rolls up traffic sources and inquiry types on a weekly basis.
Reading the numbers, then rebuilding the ad on the spot
Since the movement looked unnatural, I split it out by placement.
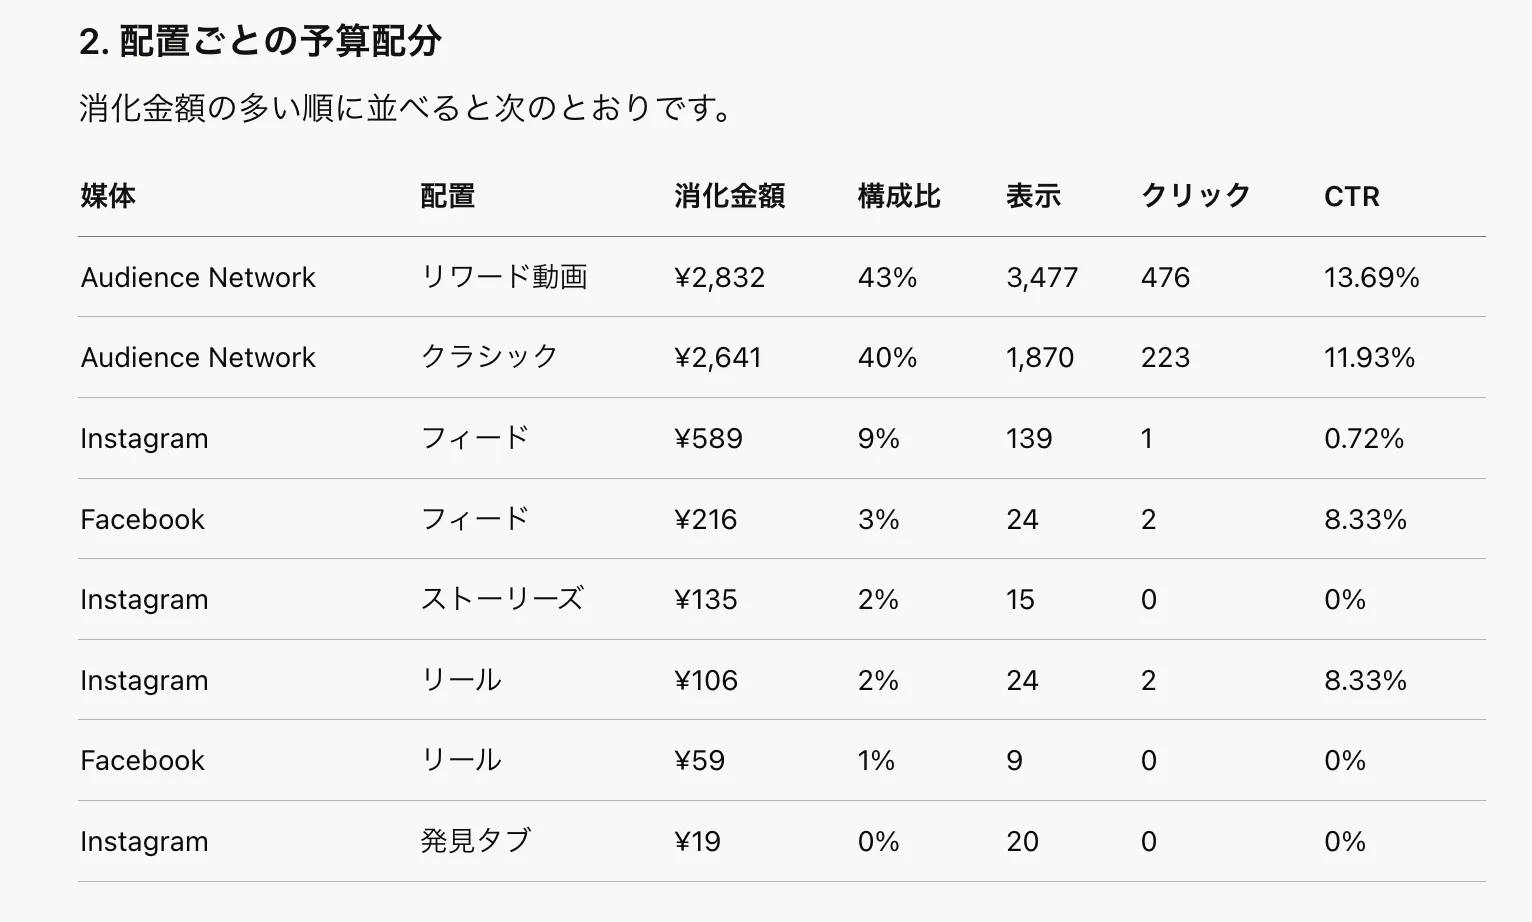
The skew was clear. The Audience Network rewarded-video slot had 3,477 impressions, 476 clicks, ¥2,832 spent, and a CTR of 13.69%. The classic Audience Network slot had 1,870 impressions, 223 clicks, ¥2,641 spent, and a CTR of 11.93%. These two alone accounted for about 96% of impressions and about 83% of spend.
Meanwhile, the Facebook feed I had actually wanted to reach had 24 impressions, 2 clicks, and ¥216 spent. The Instagram feed had 139 impressions, 1 click, and ¥589 spent. Facebook Reels, Instagram Explore, Reels, and Stories were all minimal as well.
Here is what came into view. The delivery that looked cheap and high-CTR had, for the most part, flowed to Audience Network. It had barely appeared in front of people on the Facebook or Instagram feeds. The efficiency numbers looked good, but the destination was not what I had assumed.
Since the problem was visible, I moved straight into the fix in the same flow. This too I ran entirely through the MCP for the ads. And each of these operations is reversible.
I rebuilt the ad set. This time I limited the placement to the Facebook and Instagram feeds only, and excluded Audience Network. Automatic audience expansion was off too. The target was Japan, age 25 and up. For the creative, I reused the same video I had been running.
From rebuild to activation, I progressed through conversational instructions without touching the ad manager screen directly. Not just reading metrics, but acting on what I read and making the next move -- all of it completes in one chat.
That said, this is not the end. I will write down the work that remains, honestly. First is attaching measurement parameters to the ad URL. I want to firm up the foundation that ties ads and forms together more reliably. Second is verifying whether the lead event is actually being received. Third is the question of whether this channel is even right for this product in the first place. Looking at this result, that is worth pausing to think about.
Acquisition that was split apart, fused into one conversation
What eight days of small spend made clear is simple.
Numbers tell only half the story when you look at one side. CTR 12.62%, CPC ¥9. The ad-side numbers alone do not show where most of that cheap click flowed. Only by switching to the form side in the same chat, breaking responses down by ad ID, and laying out the placement breakdown did the contents of the delivery become visible. Most of the cheap clicks had flowed to Audience Network.
That I could reach this conclusion through the fusion of two MCPs alone is the biggest takeaway this time. With the MCP for the ads, I assemble the ad, read the metrics, chart them, and -- once I find the problem -- rebuild it into a new ad set on the spot. And with FORMLOVA's MCP, I reconcile whether that ad truly produced outcomes. Operating the ad and verifying the outcome connected inside one conversation.
It is worth remembering how split apart the larger work of acquisition usually is. Form building, ad building, form management, ad management, analysis. Each is carved into a separate tool, a separate screen, a separate task. What I checked here is that, from an already-built state, management and analysis can be fused whole into a single chat. The round-trip of reopening the ad dashboard again and again disappears, and charts can be built right inside the conversation.
This is not an article that delivers the right answer for ad operations. If anything, the first delivery skewed toward Audience Network and barely reached the feeds I had actually wanted to show. Even so: I confirmed what happened with data rather than guesswork, and could move on to the next move on the spot. The ad management and form management that had been split apart connected in one conversation. That is what I most want to convey this time.
Related articles
- The FORMLOVA MCP form service, in brief -- not just building with AI, but operating after publishing
- What FORMLOVA means by an MCP-ready form service -- why it does not stop at form building but runs responses, analysis, and notifications
- Most form tools stop at building -- FORMLOVA is where it starts after publishing
- The difference between an AI form builder and an MCP form service -- choosing form operations that do not end at building
Disclosure and Verification
The numbers in this article were retrieved and executed on 2026-05-29, from a single chat in a real AI client, moving back and forth between the MCP for the ads and FORMLOVA's MCP. The ad KPIs, the daily trend, the placement breakdown, and the form response breakdown are all measured values obtained inside that conversation. Delivery ran for the eight days from May 21 to May 28; May 15 to May 20 had zero delivery. Read the figures in the body as belonging to those eight days. Identifiers visible to readers are masked.
FORMLOVA is often spoken of as a service for building forms. But as shown here, you can confirm in a single line of chat whether the traffic an ad brought in turned into outcomes -- registrations and form responses. Handle post-ad registration, form behavior, and response data in conversation, and try it once as an operations layer that gathers scattered acquisition into one place.