
Last updated: April 28, 2026
Most survey form problems do not start in the form builder.
They start after the answers arrive.
You can ask for a satisfaction score. You can add a free-text comment box. You can ask for role, company size, event attendance, or product usage. Any modern form tool can collect those answers.
The harder question is what happens next.
Which score should the team watch? Which segments should be compared? Which open-ended answers need follow-up? Should low ratings become support tasks? Should feature requests become product notes? Should the results go to CSV, Excel, Google Sheets, a report, or a chat workflow?
A survey form is not only a page for collecting feedback.
It is the first step in a decision workflow.
This guide walks through how to design a survey form that is easy to answer, easy to analyze, and easy to turn into follow-up. I will cover question structure, response segmentation, open-ended answers, FORMLOVA setup, exports, and operational follow-up.
If you want the broader map across contact forms, lead capture forms, event registrations, hiring forms, and surveys, start with the FORMLOVA Form Creation Guide. It works as the parent guide for choosing the right use-case article. If your survey is specifically about customer satisfaction metrics, read the NPS Form Template for NPS, CSAT, score calculation, and low-score follow-up.
Quick Answer: Start From the Decision After the Survey
Before writing questions, define the decision the survey is supposed to support.
Do you need to improve an event? Prioritize product work? Understand customer satisfaction? Identify people who need follow-up? Compare first-time users with returning users?
The answer changes the form.
| Decision after the survey | Useful questions | Questions that may be unnecessary |
|---|---|---|
| Improve an event | Satisfaction, attendance goal, best part, improvement area | Detailed personal demographics |
| Understand customer satisfaction | Overall score, reason category, product area, follow-up consent | Every possible user attribute |
| Prioritize product work | Usage frequency, problem area, importance, workaround | Long essays without category fields |
| Route follow-up | Contact permission, urgency, issue type, account context | Required phone number for everyone |
| Compare segments | Plan, role, customer type, usage length | Attributes the team will never analyze |
The form should include two kinds of questions:
Questions that can be summarized
Questions that explain why the summary looks that way
Closed questions create the summary. Open-ended questions explain the reason.
If you only collect scores, you miss the story. If you only collect free text, the team has to read everything manually before it can see the pattern.
A good survey form combines both.
A Practical Survey Form Structure
A useful first version can follow this structure:
Short introduction
Purpose of the survey
Estimated time to complete
Primary score question
Reason category
Open-ended explanation
Segment fields for comparison
Follow-up permission
Privacy or data-use note, when needed
This does not mean every survey needs every section.
An anonymous event feedback form may not need name or email. A customer satisfaction survey with account follow-up may need an optional contact field. A product research survey may need company size or role, while a post-webinar survey may need attendance goal and session topic.
The important choice is whether the survey is anonymous feedback or follow-up feedback.
If the goal is candid comments, reduce identity fields. If the goal is to reach out to unhappy customers, ask for permission and make contact information optional or clearly explained.
Do not decide that after collecting the data. Decide it before the form goes live.
Choose Question Types by Their Job
Survey questions have jobs.
| Question type | Best used for | Watch out for |
|---|---|---|
| Single choice | Customer type, main reason, attendance goal | Too many options |
| Multiple choice | Used features, pain points, topics of interest | Missing "Other" |
| Rating scale | Satisfaction, ease of use, likelihood to return | Scores without explanation |
| Open-ended text | Reasons, examples, ideas, complaints | Too many required text boxes |
| Contact field | Follow-up, research calls, support escalation | Asking for personal data without reason |
Closed questions are for analysis.
Open-ended questions are for understanding.
For example, a webinar survey that only asks "What did you like?" gives the team qualitative feedback, but it is hard to compare. Was the speaker the best part? The examples? The slides? The Q&A? The networking?
A better pattern is:
What was most valuable?
- Speaker
- Practical examples
- Slides
- Q&A
- Networking
- Recording
- Other

What made that valuable?
The first question gives you a chart. The second question gives you language.
That is the difference between a survey you can summarize and a survey you can learn from.
Design for Analysis Before You Publish
Many survey forms are easy to answer but hard to analyze.
That usually happens because the form was designed question by question instead of decision by decision.
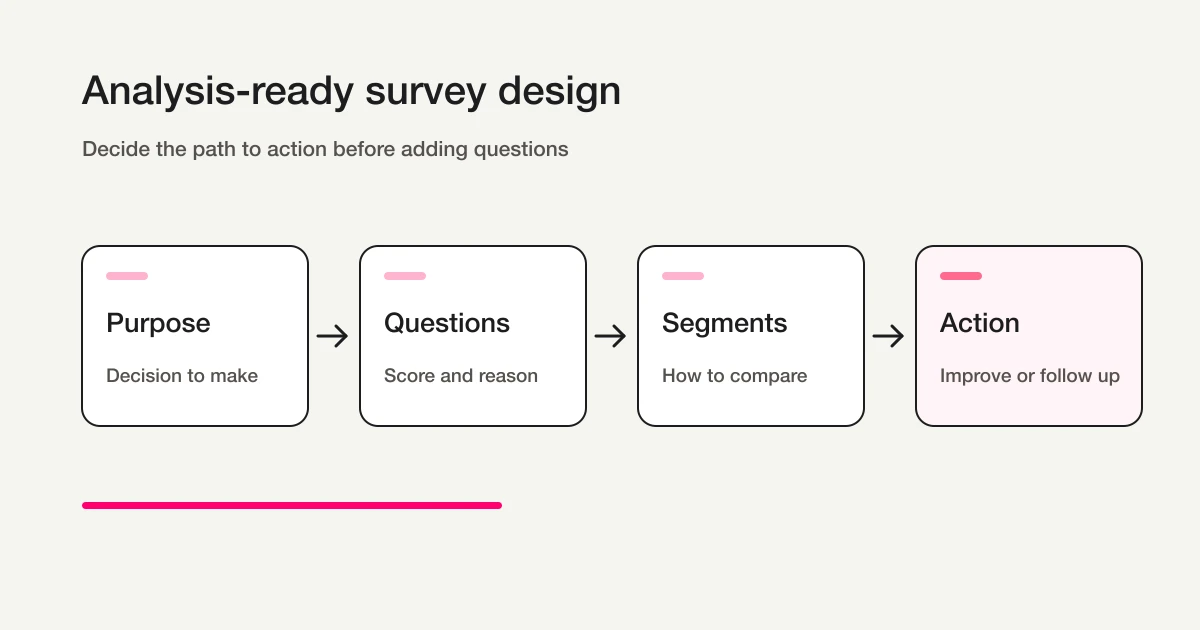
Before publishing, decide three things:
Comparison segments
Primary metric
Next action
Comparison segments are the fields you will use to split the results. For example: first-time attendee versus returning attendee, free user versus paid user, admin versus end user, customer versus prospect, or recent user versus long-term user.
The primary metric is the score the survey is centered around. It might be satisfaction, ease of use, willingness to recommend, intent to attend again, or usefulness of a session.
The next action is what the team will do with the result.
Follow up with unhappy respondents. Improve a help article. Change onboarding. Plan the next event topic. Send high-intent responses to sales. Create a product issue from repeated complaints.
If there is no next action, the survey is likely to become a report that nobody uses.
Here is a simple planning note:
Purpose: Improve the next webinar.
Segments: First-time vs returning attendees, attendance goal.
Primary metrics: Overall satisfaction and intent to attend again.
Open text: Best part and improvement request.
Next action: Review low ratings, revise slides, choose the next topic.
That note makes the form easier to build because it removes questions that do not serve the decision.
Reusable Survey Question Examples
For a customer satisfaction survey:
Which product or service did you use?
How satisfied are you with the experience?
What best explains your score?
What worked well?
What should we improve?
Would you like us to follow up?
Email address, optional
For a post-event survey:
Which event did you attend?
What was your goal for attending?
Overall satisfaction
Clarity of the session
Usefulness of the materials
Time allocation
Would you attend a future session?
What was most useful?
What should we improve?
What topic should we cover next?
For a product feedback survey:
How often do you use the product?
Which features do you use most?
Where do you get stuck?
How important is this problem?
What workaround do you use today?
What would make the product more useful?
Are you open to a follow-up conversation?
Do not make every open-ended question required.
Open text is where valuable feedback lives, but it is also where completion drops. Two or three optional text fields are usually more useful than six required ones.
How Google Forms, Microsoft Forms, and SurveyMonkey Fit
People searching for survey form software are usually considering several tools.
Google Forms is strong for simple collection. Its official help explains how to view responses in the form, view responses in Google Sheets, download responses as CSV, stop accepting responses, and collect respondent email addresses.
Microsoft Forms is natural for teams already working in Microsoft 365. Microsoft Support explains response summaries, individual response review, Excel exports, and summary sharing.
SurveyMonkey is built around survey analysis. Its help center covers summaries, individual responses, charts, filters, comparisons, show rules, open-ended response review, and exports.
Those tools are useful, and the right choice depends on the job.
FORMLOVA is different because it focuses on the workflow after the answer, not only the survey screen.
For example:
Create the survey form
Collect responses
Export to CSV / Excel
Sync to Google Sheets
Filter low scores
Summarize open-ended themes
Mark follow-up responses
Draft a reply
Turn repeated feedback into next actions
If your survey stops at a chart, a traditional survey tool may be enough. If the survey needs to become operational work, you should evaluate what happens after submission.
The key distinction is between research survey and operational feedback. Annual large-scale surveys (N=1,000+) needing statistical significance, weighting, and year-over-year comparison belong in SurveyMonkey. Monthly CSAT, post-event surveys, and low-score follow-up where a response triggers business action belong in FORMLOVA. The SurveyMonkey vs FORMLOVA comparison explains the boundary with case studies and hybrid setups.
Build the Survey in FORMLOVA
In FORMLOVA, you can start from a plain-language request.
For example:
Create a post-webinar survey form. The goal is to improve the next session. Include overall satisfaction, attendance goal, clarity, material usefulness, whether they would attend again, best part, improvement request, and optional email for follow-up.
FORMLOVA creates a private draft.
Before publishing, review the draft with four questions:
Is the purpose clear at the top?
Are closed and open-ended questions balanced?
Are comparison segments included?
Can we act on low scores or follow-up requests?
Then refine it in chat:
Make attendance goal a single-choice question with these options: learning, vendor comparison, implementation planning, existing customer education, other.
Then reduce friction:
Keep only two open-ended questions: "What was most useful?" and "What should we improve?" Make both optional.
Then add operational context:
Add an optional email field only for people who want follow-up. Add a short note explaining that the email is used only for follow-up about their response.
This workflow keeps the form focused. You are not just creating questions. You are deciding how the answers will be used.
For the general creation workflow, see How to Create Forms with ChatGPT or Claude.
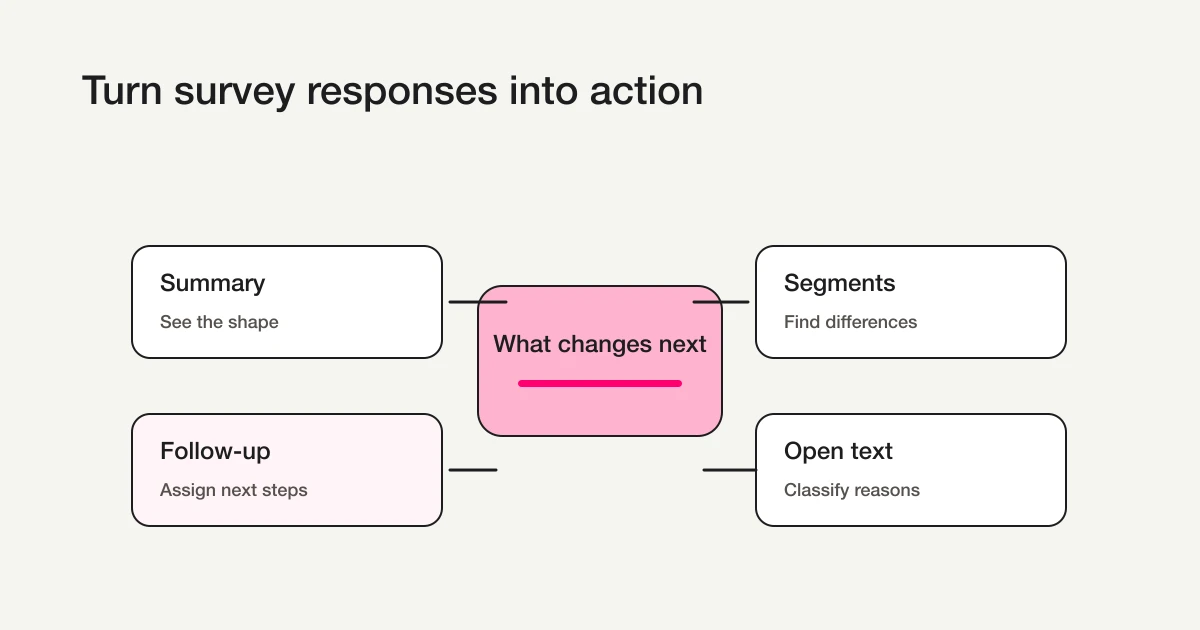
Review Responses in the Right Order
When responses start arriving, do not read open-ended answers first.
Start with the summary.
Response count
Primary score distribution
Low-score percentage
Segment differences
Follow-up requests
Then read open-ended answers inside the segment that matters.
Why this order?
Open-ended comments are emotionally strong. A detailed complaint can feel representative even when it is one response. A glowing testimonial can make the survey feel better than the score actually is.
Numbers give the shape. Comments give the reason.
FORMLOVA's Free plan includes response search, status management, and CSV / Excel export. You can collect responses, inspect them, and take your data out without hitting a response export wall.
Google Sheets automatic sync, free-text analysis, advanced analysis, recurring reports, and auto insights are available on Standard and above. Standard is JPY 480 per month.
For exports and Sheets setup, see Export Responses to CSV or Sync Them to Google Sheets.
Categorize Open-Ended Answers Before Reading Everything
Open-ended responses are often the most useful part of a survey.
They are also the hardest to process.
Instead of reading every comment from top to bottom, classify them first.
For an event survey, a simple set of categories might be:
| Category | Examples |
|---|---|
| Strong content | Practical examples, topic relevance, speaker quality |
| Useful materials | Slides, templates, recording, checklist |
| Time issue | Too short, too long, rushed Q&A |
| Too difficult | Jargon, assumed knowledge, pace |
| Next topic request | Deeper session, industry-specific version, workshop |
| Follow-up request | Consultation, demo, implementation question |
Once comments are grouped, action becomes easier:
Many "time issue" comments -> adjust agenda and Q&A.
Many "too difficult" comments -> add prerequisites or glossary.
Many "next topic" comments -> plan the next session.
Follow-up requests -> send to the right owner.
FORMLOVA's free-text analysis and auto insights are Standard features. A practical path is to start with CSV / Excel export on Free, then automate classification once the survey becomes recurring.
The principle stays the same:
Do not treat open-ended answers as a pile of comments. Turn them into themes.
Move Follow-Up Responses Into Status Management
Some survey answers should become tasks.
For example:
Low satisfaction score
Churn or cancellation signal
Bug or incident report
Follow-up request
High-intent buying signal
Repeated product complaint
These should not sit inside a chart.
Give them a status.
| Status | Meaning | Next action |
|---|---|---|
| New | Not reviewed yet | Read response |
| Needs follow-up | Someone should contact the respondent | Assign owner |
| Improvement candidate | Useful for product or operations | Add to improvement notes |
| Next topic idea | Useful for future content or events | Review during planning |
| Done | Action has been taken | Keep as record |
In FORMLOVA, you can search, filter, and update response status from chat.
For example:
Show responses with satisfaction 2 or lower and follow-up permission.
Then:
Mark these three responses as Needs follow-up.
Then:
Draft a reply for the first respondent, acknowledging the issue and asking one clarifying question.
That is the difference between a survey report and a survey workflow.
The report tells you what happened. The workflow helps you do something about it.
For the underlying response workflow, see View, Filter, and Update Response Status with FORMLOVA.
Launch Checklist
Before publishing the survey, run this checklist:
The survey purpose fits in one sentence.
The form is not too long.
There are one or two primary metrics.
There are useful comparison segments.
Open-ended questions are limited.
Personal data is optional or clearly explained.
Follow-up permission is explicit.
Low-score handling is defined.
Export or Google Sheets workflow is clear.
The team has tested sample responses.
The test matters.
Add at least three fake responses before launch:
High score
Low score
Follow-up requested
Then check the summary, filters, export, and status workflow.
If you cannot find the low-score response quickly during a test, the real survey will be harder to operate.
Common Mistakes
The first mistake is asking too many open-ended questions.
Open text is valuable, but it is expensive for respondents and reviewers. Use it where explanation matters most.
The second mistake is mixing option levels.
For example: "price", "ease of use", "support", and "I just felt unsure" are not the same type of answer. Keep options at the same level so the chart means something.
The third mistake is collecting attributes the team will not analyze.
Role, industry, plan, company size, region, usage length, and age group can all be useful. They can also be noise. If you will not compare by the attribute, do not ask for it.
The fourth mistake is leaving low scores without an owner.
A low score is an opportunity to learn or recover. Decide who reviews it before the survey opens.
The fifth mistake is treating the survey result as the final deliverable.
The result is not the deliverable. The decision is.
FAQ
Should a survey form be anonymous?
If the goal is candid feedback, anonymous surveys can reduce friction.
If the goal is follow-up, support recovery, sales qualification, or research calls, ask for contact information only when the respondent opts in. A practical pattern is to keep the main survey anonymous, then add an optional email field for people who want follow-up.
How many questions should a survey form have?
Start small: one or two primary metrics, one or two reason categories, two open-ended questions, and a few segment fields.
The exact number matters less than whether each question will be used. If the team will not compare by a field or act on an answer, remove it.
Should I use CSV exports or Google Sheets sync?
For a one-off survey, CSV or Excel export is often enough.
For recurring surveys, team review, dashboards, or workflow automation, Google Sheets sync is easier to maintain. FORMLOVA includes CSV / Excel export on the Free plan. Google Sheets automatic sync is available on Standard and above.
Related Workflows You Can Use
For survey operations, Post-survey Follow-up is the first Workflow Place route to attach. It makes the form response useful after collection by connecting answers to a follow-up action.
If low scores or open-text answers matter, add Low-score Survey Owner Alert and Open-text Theme Report. Those workflows keep qualitative feedback from becoming a spreadsheet nobody reads.
Summary
A survey form is easy to create and easy to waste.
To make it useful, design from the action backward.
Define the decision. Choose the segments. Pick the primary metric. Add only the open-ended questions that explain the result. Decide how low scores and follow-up requests will be handled.
FORMLOVA helps with the workflow around the survey: drafting the form, collecting responses, searching and filtering answers, exporting to CSV / Excel, syncing to Google Sheets, managing status, and expanding into free-text analysis or recurring reports when the survey becomes part of ongoing operations.
If the survey will run more than once, read the FORMLOVA Form Automation Guide next. Low-score notifications, follow-up status, Google Sheets sync, and recurring reports should be designed before the answers start coming in.
Start with one sentence:
What decision should this survey help us make?
If that sentence is clear, the form becomes much easier to build.
Disclosure and Verification
This guide is for teams that need to build a survey form and actually use the results. I work on FORMLOVA, so I include the FORMLOVA workflow. I checked official help pages from Google Forms, Microsoft Forms, and SurveyMonkey on April 28, 2026 for response viewing, summaries, Excel / CSV / Google Sheets exports, filters, comparisons, and open-ended response handling.