
Last updated: October 15, 2026
For a five-point satisfaction survey, ask about one specific experience and label all five choices. Keep “not used” or “not applicable” outside the scored continuum. Review counts and percentages at each point, then reasons and context; a mean alone cannot tell you what to change.
Before building the form, choose the decision, eligible respondents and repeat-measurement conditions. The example below turns that design into a draft you can inspect without promising a validated scale or better satisfaction.
The short answer: fix the labels and the decision before launch
| Design choice | A clear starting point | Avoid |
|---|---|---|
| Experience | One event, such as the support interaction just completed | Product, price, and service combined |
| Question | “How satisfied were you with…?” | “Were you happy with our excellent service?” |
| Scale | Meaning shown for all five response options | Numbers with unexplained intermediate points |
| Non-use | A separate not-applicable option | Treating non-use as the midpoint |
| Analysis | Counts, percentages, reasons, and context | Declaring success from the mean alone |
| Follow-through | One action, owner, deadline, and repeat measure | Sharing a chart without a decision |
If you are still planning the complete questionnaire, start with the survey form and analysis guide. If your organization has already chosen a formal CSAT or NPS metric and needs its calculation rules, use the separate NPS and CSAT form guide.
Step 1: Define the experience and decision
“Measure satisfaction” is not yet a survey objective. It does not tell a respondent which experience to recall, and it does not tell a team what it will do with an answer. Narrow the object to something respondents experienced in a similar way: a purchase, onboarding session, support conversation, delivery, event, or specific product feature.
A question such as “How satisfied were you with the support conversation you just completed?” is easier to answer than “How satisfied are you with our company?” The first has a clear event and time. The second can mix brand perception, price, product quality, and several past interactions. If the team receives a low company-level score, it may not know which process it can change.
Write down the decision before writing more questions. Examples include revising an onboarding explanation, investigating a wait-time problem, choosing one workshop section to change, or deciding whether a known issue should receive the next improvement slot. The decision should be within the receiving team's control. A question that cannot change any decision adds work for the respondent without creating a responsible next step.
Define who can answer and when. A first-time user and a long-term customer may use the same feature with different expectations. An immediate post-service survey captures a recent interaction; a survey sent a month later can reflect the longer outcome but also introduces other experiences and recall. Neither timing is universally correct. Choose the timing that matches the decision, then keep it stable when comparing waves.
Record the invitation channel, eligibility rule, field period, and response deadline. A link displayed to every completed customer is not directly comparable to an email sent only to selected accounts. If the method changes, annotate the series or begin a new baseline instead of presenting the difference as an effect of an operational change.
Also choose between anonymous feedback and individual follow-up. An anonymous form can reduce the personal data collected and may make critical comments easier to share. A follow-up route requires a contact preference and contact detail, preferably separated from the satisfaction item and made optional where the process allows. Requiring identity can change who responds and how they answer, so do not silently compare identified and anonymous waves.
The introduction should briefly state the experience being reviewed, the approximate effort, how the response will be used, and whether a person may be contacted. This is more useful than a long welcome message. It also gives the editor a clear basis for deleting demographic questions that will not be used.
Step 2: Write the five-point question and labels
Ask one thing at a time. “How satisfied were you with the product quality and the staff response?” is double-barrelled. A customer who likes the product but had a poor service interaction cannot give an accurate single answer. Separate the topics if both lead to separate decisions, or retain only the topic owned by this survey.
Use neutral wording. “How satisfied were you?” allows the dissatisfied end of the continuum. “Were you satisfied with our helpful service?” implies that satisfaction is expected and even supplies a positive description. Avoid explaining a recent failure in the question itself; contextual notes can unintentionally ask respondents to excuse it.
Label every point rather than showing only “1 = bad” and “5 = excellent.” A defensible starting pattern is:
| Stored value | Visible label | Operational reading |
|---|---|---|
| 1 | Very dissatisfied | Strong dissatisfaction |
| 2 | Dissatisfied | Dissatisfaction |
| 3 | Neither satisfied nor dissatisfied | No direction selected |
| 4 | Satisfied | Satisfaction |
| 5 | Very satisfied | Strong satisfaction |
You may display high-to-low or low-to-high, but keep the direction consistent throughout the form and across measurement periods. Document that 5 is the high end in the data dictionary. During testing, verify that the exported or analyzed value still corresponds to the visible label. Reversing the screen order without checking stored values can produce a serious interpretation error.
“Not applicable,” “I did not use this,” and “I do not know” are not satisfaction levels. If they are plausible, make them separate choices and decide in advance how they will be reported. Do not silently assign them a score of 3. Missing responses are also not zero satisfaction. Report missing and excluded answers separately from valid five-point responses.
A single satisfaction question is often casually called a Likert scale, but the terminology matters when documenting research. Rensis Likert's 1932 method used responses to multiple statements to construct a measure of attitude. One question asking “How satisfied were you?” is better described as a five-point satisfaction item or a Likert-type item. It does not automatically become a validated multi-item Likert scale. If you intend to combine several items into a scale score, item development, reliability, and validity require a separate research plan.
To display all five verbal labels as choices in FORMLOVA, use a single_select field with options from “1 Very dissatisfied” through “5 Very satisfied.” The current rating_scale field can display the numbers 1 through 5, but its label configuration stores and renders only the two endpoint labels. If you use rating_scale, label the endpoints “Very dissatisfied” and “Very satisfied,” then state the complete mapping—1 very dissatisfied, 2 dissatisfied, 3 neither, 4 satisfied, and 5 very satisfied—in the field description. If some respondents did not use the service, put “Not applicable” in a separate question or an earlier branch rather than inside the scored scale. Preview desktop and mobile, submit test responses at both endpoints and the midpoint, and verify the stored values. Product support for a field type does not establish questionnaire validity or an improved outcome.
Prototype a support-interaction item with all labels visible
This is a proposed trial, not an operation or result measured for this rewrite. Use a private test draft first.
Create a private survey draft for the support interaction just completed. First ask whether the person used support; show a single-choice question only to users, with 1 Very dissatisfied, 2 Dissatisfied, 3 Neither satisfied nor dissatisfied, 4 Satisfied, 5 Very satisfied. Add an optional main reason. Do not collect names, send invitations or publish.
Before proceeding, check:
- Confirm every verbal label is visible; a numeric rating field only has endpoint labels.
- Test the non-user route and ensure it does not become a score of 3.
- After controlled publication, verify endpoints, midpoint and optional blank reason against the stored/exported values. Keep pilot data outside the final baseline.
Check a fully labelled satisfaction item on Free
Free covers the draft, collection and CSV/Excel export. Start with the labels and eligibility; paid detailed analytics can be considered after the collection design is sound.
Register free and draft the satisfaction item
Register, verify your email, connect a supported AI client, and paste the proposed request above. Check the saved draft before publishing. AI-client account and usage requirements apply separately.
Step 3: Add a reason question and minimal segments
The score tells you where an answer sits, not why it sits there. Immediately after the main item, add one optional prompt such as “What was the main reason for your answer?” The word “main” encourages the respondent to identify a priority. An optional response is often more appropriate than forcing every respondent to compose a paragraph, particularly in a survey sent immediately after a task.
If the improvement team already has a short list of controllable areas, you can ask respondents to select the one area that most influenced the answer, followed by an optional comment. Include “Other” with a text field so the list does not erase unexpected causes. Do not only ask dissatisfied respondents for a reason. Reasons from satisfied respondents can reveal practices worth protecting. Conditional paths can use different prompts, but both ends should retain a way to explain the rating.
Add segmentation variables only when someone has a defined comparison to make. Store, product plan, first-time versus returning use, service channel, or feature used can be actionable. Age, gender, exact location, and job title should not be collected merely because they might be interesting later. Unused data adds respondent burden and governance work.
Small groups need particular care. A percentage based on four responses can move dramatically when one person answers differently, and combining detailed segments may make an individual recognizable. Establish a minimum reporting rule appropriate to the context, avoid publishing tiny cells, and do not describe unstable subgroup differences as established patterns.
Before launch, run a respondent-focused check:
- Can only people who experienced the target event enter the survey?
- Is the meaning and direction of all five labels visible without guessing?
- Can a non-user choose not applicable instead of the midpoint?
- Does each question contain only one object of evaluation?
- Can the respondent submit without writing a long explanation?
- Are all labels and the submit control readable on a phone?
- Does the completion screen make clear that the response was received?
The US Centers for Disease Control and Prevention's Collaborating Center for Questionnaire Design and Evaluation Research evaluates how people understand and answer questions, including through cognitive interviewing. You do not need a large laboratory study to learn from the principle. Before a broad launch, ask a few people resembling the target respondents to complete the form and explain what they thought each question and option meant. Their interpretation is more informative than an editor saying that the wording “looks clear.”
Keep the pilot separate from the final baseline if you change wording or labels afterward. Otherwise, responses to two different instruments can appear in one trend. Save the version, launch date, and change note with the results.
Step 4: Analyze the distribution and assign an action
Begin with valid response count and the count and percentage for each of the five categories. Suppose 100 valid responses are distributed as 8 at 1, 12 at 2, 25 at 3, 40 at 4, and 15 at 5. The arithmetic mean is 3.42, but that number hides the fact that 20 people selected a dissatisfied category and 25 selected the midpoint. A different, polarized distribution can produce a similar mean.
Report not-applicable, missing, duplicate, test, and otherwise excluded responses separately. Decide exclusion rules before studying the results and document them. When presenting a percentage, include its denominator: “55 of 100 valid responses selected 4 or 5” is clearer than “satisfaction is 55%.” If you define a satisfied share, state which categories are included and keep the definition stable.
Compare time periods or segments only after checking comparability. The question text, labels, audience, invitation route, field period, and eligibility rules should be the same or their differences should be disclosed. A small mean increase is not, by itself, proof that an intervention caused an improvement. Sampling differences, response behavior, seasonality, and other operational changes can also be related. For consequential inference, involve a survey-methodology or statistics specialist.
FORMLOVA Free supports response collection, search, basic response counts and CSV/Excel export. Cross-tabulation, detailed distributions, free-text statistics and PDF reports require Standard or above. Client-side AI interpretation depends on the connected AI service and needs a check against original comments; the server does not automatically create an unrestricted semantic summary. The survey response AI analysis guide separates these later analysis steps.
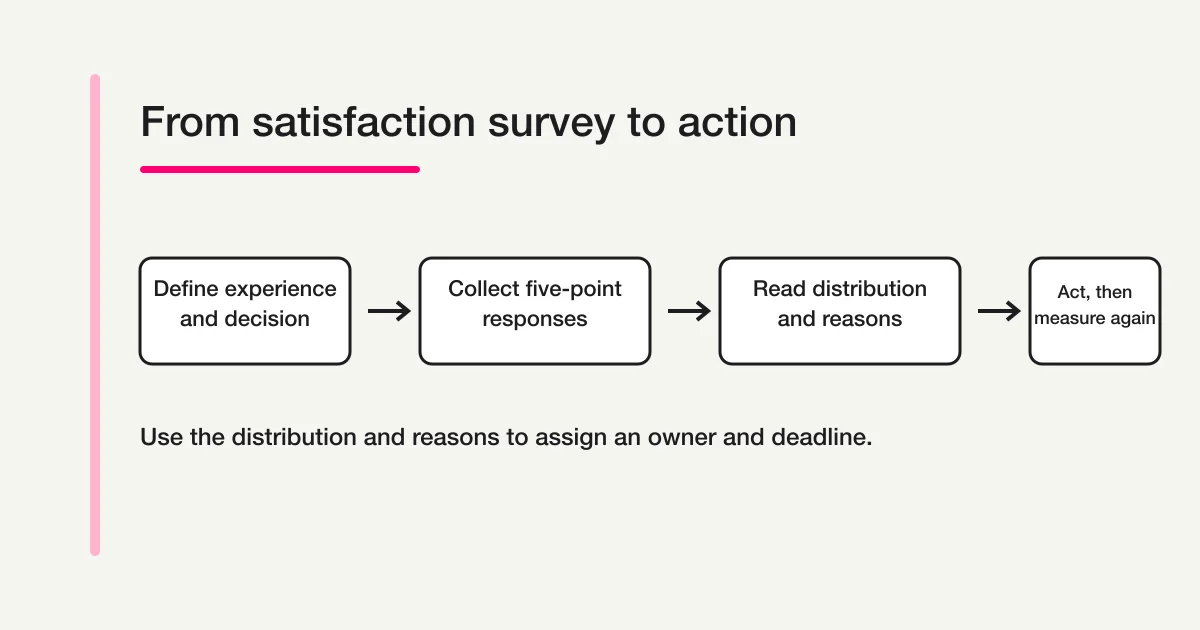
Turn the result into one owned action:
- Select one experience with a meaningful dissatisfied or uncertain pattern.
- Review comments and operational evidence to form a reason hypothesis.
- Define a change, an owner, and a deadline.
- Repeat the same item with the same eligible audience and timing.
- Review the new distribution and reasons, noting any method changes.
Changing many processes at once makes attribution harder. A satisfaction survey is not a contest to display the highest score. It is a repeatable observation that helps a team decide what to inspect and what to try next. If the evidence does not support a confident change, record the uncertainty and choose a smaller investigation instead of inventing a conclusion.
A practical interpretation table
| Evidence | What it helps you see | What it cannot establish alone |
|---|---|---|
| Count and percentage at each point | Shape of the response distribution | Reasons for the ratings |
| Share selecting 4 or 5 | Size of the satisfied side under your definition | A universal industry benchmark |
| Share selecting 1 or 2 | Size of the dissatisfied side | Which intervention caused the problem |
| Midpoint responses | Number choosing no direction | Whether they were indifferent, unsure, or ineligible |
| Mean | A compact summary under stable conditions | Polarization or minority experiences |
| Open comments | Candidate reasons and unexpected issues | Prevalence across all eligible people |
| Segment comparison | Where an operational difference may exist | Causality, especially with small or changing samples |
Archive the field dates, eligible population, invitations, responses, valid responses, exact question, labels, exclusions, and form version. A chart without these definitions cannot be reliably reproduced in the next cycle.
Common questions about five-point satisfaction surveys
Should the midpoint say “Neutral” or “Average”?
Use a phrase that matches the question, such as “Neither satisfied nor dissatisfied.” “Average” asks the respondent to compare with an unspecified reference, while “neutral” can be interpreted as indifference, lack of experience, or uncertainty. Give ineligible or uncertain respondents a separate route when those states matter.
Is a four-point scale better because it removes the midpoint?
Not automatically. Removing the midpoint forces a direction even when neither satisfaction nor dissatisfaction is an honest answer. Choose the number of categories based on the construct and the decisions, test the labels with respondents, and keep the scale stable over comparisons.
What average score counts as good?
There is no universal pass mark for every satisfaction survey. Expectations, audience, event, invitation method, and wording differ. Define an internal decision rule with context, then examine the full distribution and reasons. Do not borrow a benchmark unless its population and method are sufficiently comparable.
Is this the same as CSAT or NPS?
No. Some organizations define a CSAT percentage from a five-point satisfaction item, but they must state which categories count as satisfied and which responses enter the denominator. NPS asks a recommendation question on a 0–10 scale and applies a different classification and calculation. Use the dedicated metric guide when formal CSAT or NPS reporting is the goal.
Should every satisfaction question be required?
The main item can be required when every eligible respondent experienced the subject and the form makes that eligibility clear. A not-applicable route is necessary when experience may vary. A reason comment is often better left optional. A forced answer from someone without the experience creates data, but not a valid satisfaction judgment.
Can I compare this month's result with last month's?
Yes, when question wording, labels, scoring direction, eligibility, timing, and invitation method remain sufficiently stable. If any changed, show the change next to the series. It may be more honest to establish a new baseline than to draw a continuous line through incompatible measures.
Primary sources reviewed
- Rensis Likert, A Technique for the Measurement of Attitudes (1932; reviewed 2026-09-04): the original work describes constructing attitude measurement from responses across multiple statements.
- UK Local Government Association, Benchmarking resident satisfaction data (reviewed 2026-09-04): a public-sector example of standardized satisfaction categories for comparison.
- Waverley Borough Council, Tenant Satisfaction Measures Questionnaire (reviewed 2026-09-04): a public questionnaire that spells out the five verbal satisfaction options.
- US CDC, Collaborating Center for Questionnaire Design and Evaluation Research (reviewed 2026-09-04): primary public information on evaluating how respondents understand survey questions.
What to do next
Choose one decision and retain wording, labels, eligibility and exclusions with the results. Use the pilot to find interpretation errors before treating later responses as a baseline.
Prototype your satisfaction survey in FORMLOVA
FORMLOVA lets you choose between a single-select field that visibly lists all five labels and a rating scale that shows numbers with two endpoint labels, then add an optional reason question and the minimal segments you plan to review. Keep not-applicable outside the scored scale through a separate question or earlier branch, and test the complete form before inviting respondents.
Create a satisfaction survey with FORMLOVA
Disclosure and Verification
This article was written by the team developing FORMLOVA. Product statements were checked against the current SPEC, field schema, and analytics implementation on 2026-09-04, while the survey-design statements were checked against the primary sources above. Describing an available FORMLOVA feature does not guarantee questionnaire validity, statistical significance, higher satisfaction, or a business outcome.