
Last updated: August 13, 2026
A form submissions dashboard should answer a small set of recurring operational questions: what arrived, what still needs attention, who owns it, what is overdue, and whether the pattern is changing.
It should not be a prettier copy of the response table.
The response table stores records. The dashboard summarizes operational state and makes exceptions visible.
This guide explains the minimum viable dashboard for contact forms, bookings, applications, events, and surveys. It also separates the jobs of a dashboard, a spreadsheet, a BI tool, and an AI conversation.
Start With Five Blocks
The first dashboard needs only five blocks.
In the examples below, owner, due-time, and SLA-style fields describe an operations layer that you define. They are not presented as built-in FORMLOVA response columns. Keep them in an external operating ledger such as Sheets or a CRM, in form fields created for the workflow, or in a documented notes/tags convention, then reconcile them with the FORMLOVA response ID and native response status.
| Block | Question | Recommended view |
|---|---|---|
| Intake | How many submissions arrived? | Daily or weekly trend |
| Queue | What is open? | Count by status |
| Ownership | Who is responsible? | Open count by owner |
| SLA | What needs attention now? | Unassigned and overdue list |
| Content | What is arriving? | Category and selected themes |
Keep definitions next to the numbers. “Open” might mean new plus in progress, or it might also include waiting. “Response time” might mean the first automated email or the first human reply. If definitions are hidden, the dashboard creates arguments rather than decisions.
Choose Metrics Before Choosing the Tool
Write each metric as a rule.
new_count = status is new at the end of the reporting window
unassigned_count = owner is empty and status is not done or excluded
overdue_count = due_at is before now and status is not done or excluded
first_human_response_time = first human reply timestamp - submitted_at
resolution_time = resolved_at - submitted_at
Then record timezone, business-hour policy, and exclusions. A dashboard cannot repair ambiguous data after the fact.
For the broader analytical framework, read Form Analysis. For state definitions, use Form Response Status Management.
Store the Fields That Make the Dashboard Possible
A practical dashboard row usually needs the following conceptual fields. FORMLOVA does not natively provide every owner and SLA field in this list, so implement the additional values in your external ledger, purpose-built response fields, or documented notes/tags convention:
response_id
form_id
submitted_at
category
source
status
owner
priority
first_response_due_at
first_human_response_at
last_activity_at
resolved_at
outcome
exclusion_reason
The message body can remain in the detail view. A shared dashboard should avoid exposing personal data that is unnecessary for monitoring. Use a response ID and short, redacted summary to link from the exception queue to the authorized record.
Design the Queue Before the Charts
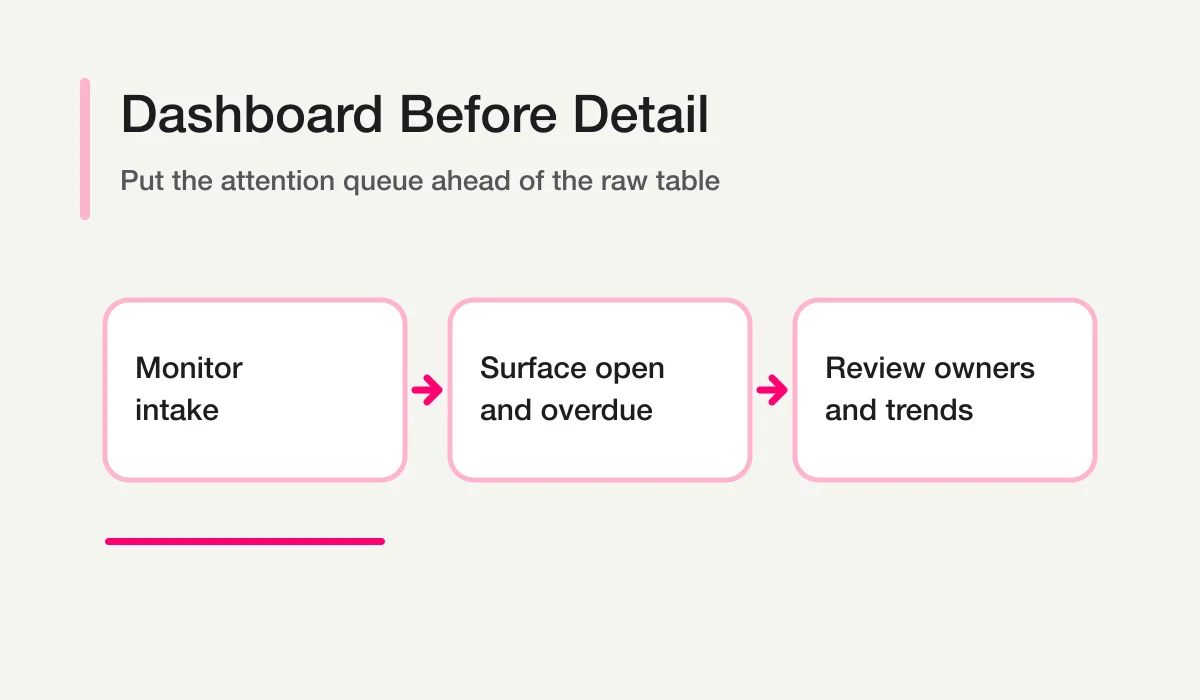
The most important dashboard component is usually a short action queue.
1. Overdue high-priority responses
2. Unassigned new responses
3. Responses due in the next operating window
4. Waiting responses with no recent activity
5. Records marked needs_review
Every row needs a reason. “Overdue” should show the deadline and the rule used. “High priority” should show whether it came from a human label, deterministic rule, or AI suggestion.
Do not let a color become the only explanation. Color helps scanning, but text and timestamps make the record auditable and accessible.
Adapt the Dashboard to the Form Type
Contact forms
Emphasize unassigned, first-response deadlines, category, legitimate-versus-sales-pitch review, and owner workload. The dashboard is an operational inbox, not just a traffic report.
Booking and event forms
Emphasize the requested date, confirmation state, changes, cancellations, and questions that affect the next delivery window.
Applications
Emphasize stage, missing required information, reviewer ownership, and due dates. Do not expose sensitive application details in a broadly shared dashboard.
Surveys
Emphasize response volume, score distributions, segment filters, free-text coverage, and low-score follow-up where permission exists. Survey methodology belongs in Survey Analysis AI, not in the dashboard itself.
Decide Where the Dashboard Should Live
| Surface | Best for | Limitation |
|---|---|---|
| FORMLOVA dashboard / Live Pulse | Current operational state and quick monitoring | Not a general-purpose BI warehouse |
| Google Sheets | Flexible shared log and lightweight formulas | Status and permissions require discipline |
| BI tool | Multi-source historical reporting | Often too slow for individual response handling |
| Slack or Teams | Alerts and discussion | Messages do not prove completion |
| AI chat | Exploratory questions and summaries | Not the durable source of truth |
Use the smallest surface that supports the decision. A small team can start with a controlled Sheets view. A team that regularly assigns, escalates, replies, and audits responses benefits from keeping state in the response system and using Sheets as an export or secondary log.
For exports and synchronization, see Export Responses to CSV or Google Sheets. For broad inquiry-management tradeoffs, see Inquiry Management From a Contact Form.
Keep Chat and Dashboard Roles Separate
A dashboard answers fixed questions repeatedly. AI chat handles temporary or exploratory questions.
Dashboard:
- How many open responses exist now?
- Which owner has overdue work?
- How did weekly volume change?
- Which categories are increasing?
Chat:
- What changed in the wording of this week’s inquiries?
- Which overdue responses appear most urgent, and what evidence supports that?
- What new theme is not represented in our existing categories?
- Which dashboard definition might be hiding a problem?
The AI output should point back to dashboard definitions and response IDs. It should not create a second status system inside the conversation. Chat With Form Responses covers this boundary in detail.
Add AI as an Annotation Layer
AI can add helpful annotations:
- candidate category;
- redacted summary;
- urgency reason;
- likely owner role;
- emerging theme;
needs_reviewflag.
Show the provenance. A human-confirmed category and an AI-suggested category should not look identical. Preserve unknown rather than forcing a classification. Do not let AI silently delete, exclude, assign, or send.
Run a 15-Minute Weekly Review
Use the dashboard in the same order every week.
- Confirm the reporting window and exclusions.
- Review overdue and unassigned work.
- Check owner workload and waiting records.
- Compare intake and category mix with the previous period.
- Review low ratings and emerging free-text themes.
- Assign no more than three improvement actions.
- Record the owner and next review date.
A useful weekly note might read:
Window: August 3-9, UTC
Legitimate submissions: 64
Open: 12; unassigned: 3; overdue: 2
Main change: billing questions increased from 8% to 19%
Action: revise pricing FAQ; owner: marketing; review: September 7
Limitation: campaign outcome attribution is not reconciled
If the dashboard needs a durable event trail before weekly aggregation, start with Slack Notification + Sheets Log. It keeps the immediate team alert and the row-level log together, so the dashboard can be checked against source records instead of relying on a summary alone.
For a recurring operational output, use the Inquiry Weekly Status Report. For an AI-generated content summary, use the AI Response Report.
Validate the Dashboard Against Real Records
Before the team relies on the dashboard, reconcile every block with a small set of records from the source of truth.
- Choose a fixed window with known new, assigned, waiting, done, and excluded examples.
- Calculate the expected counts manually.
- Confirm that the dashboard uses the same timezone and end-of-window rule.
- Open every row in the overdue and unassigned queues.
- Check that excluded records remain auditable without entering normal totals.
- Confirm that users without permission cannot open restricted response details.
- Change one test record and verify that the expected block changes once, not twice.
Also test empty states. A zero should mean “the query ran and found no matching records,” not “the data source failed.” Show retrieval failures, stale refresh times, and missing fields explicitly. Operational users should never have to guess whether an empty panel is good news.
Finally, record freshness. A live operational surface and a nightly BI extract can both be correct while showing different moments. Add a visible “data current through” timestamp and state which dashboard should be used for immediate response handling.
Common Dashboard Mistakes
| Mistake | Result | Correction |
|---|---|---|
| One giant table | Exceptions disappear | Put a short queue first |
| Too many charts | Nobody knows what to act on | Limit the first view to five blocks |
| Notifications counted as handled | Missed replies look complete | Use explicit status and first human response |
| No exclusion policy | Tests and sales pitches distort demand | Show excluded records separately |
| Personal data on a shared screen | Unnecessary exposure | Use IDs and redacted summaries |
| AI labels shown as facts | Ambiguity is hidden | Show provenance and needs_review |
How FORMLOVA Fits
FORMLOVA provides response retrieval, summaries, analytics, and a Live Pulse view through its chat-first interface and MCP tools, while the dashboard remains available for monitoring and detail. The connected AI client can ask exploratory questions without turning the conversation into the authoritative database.
A practical setup is:
- Keep the native response status in FORMLOVA; keep owner and SLA metadata in a linked external ledger, purpose-built response fields, or a documented notes/tags convention.
- Use Live Pulse or the dashboard for current exceptions.
- Send only relevant alerts to the team channel.
- Use Sheets when a secondary operational log is genuinely needed.
- Ask the AI client for summaries and new questions.
- Confirm the native status in the response record and reconcile the linked owner/SLA record by response ID.
You can start with FORMLOVA and connect an AI client with the setup guide.
If the dashboard is one part of a larger post-submit system, continue to the FORMLOVA Form Automation Guide.
Disclosure and Verification
- Dashboard and MCP claims were checked against FORMLOVA’s local SPEC and implementation on August 13, 2026.
- This guide does not rely on a current feature or pricing claim for any third-party BI, spreadsheet, or messaging product.